
Bitcoin Price Tracking with React Query
Use React Query and Victory Charts to plot real-time cryptocurrency data.
As of 2021, you've no doubt heard of Bitcoin and other cryptocurrencies. Whether you think they are the next big thing, or just a fad, following their wild price changes is a roller coaster! As an opportunity to work with some new tools and a new API, I wrote a component to track the price of Bitcoin.
Today we'll be building a price tracker for Bitcoin with real-time data from the CoinGecko API. To do that, we'll be using React Query for data fetching and Victory Charts to visualize that data.
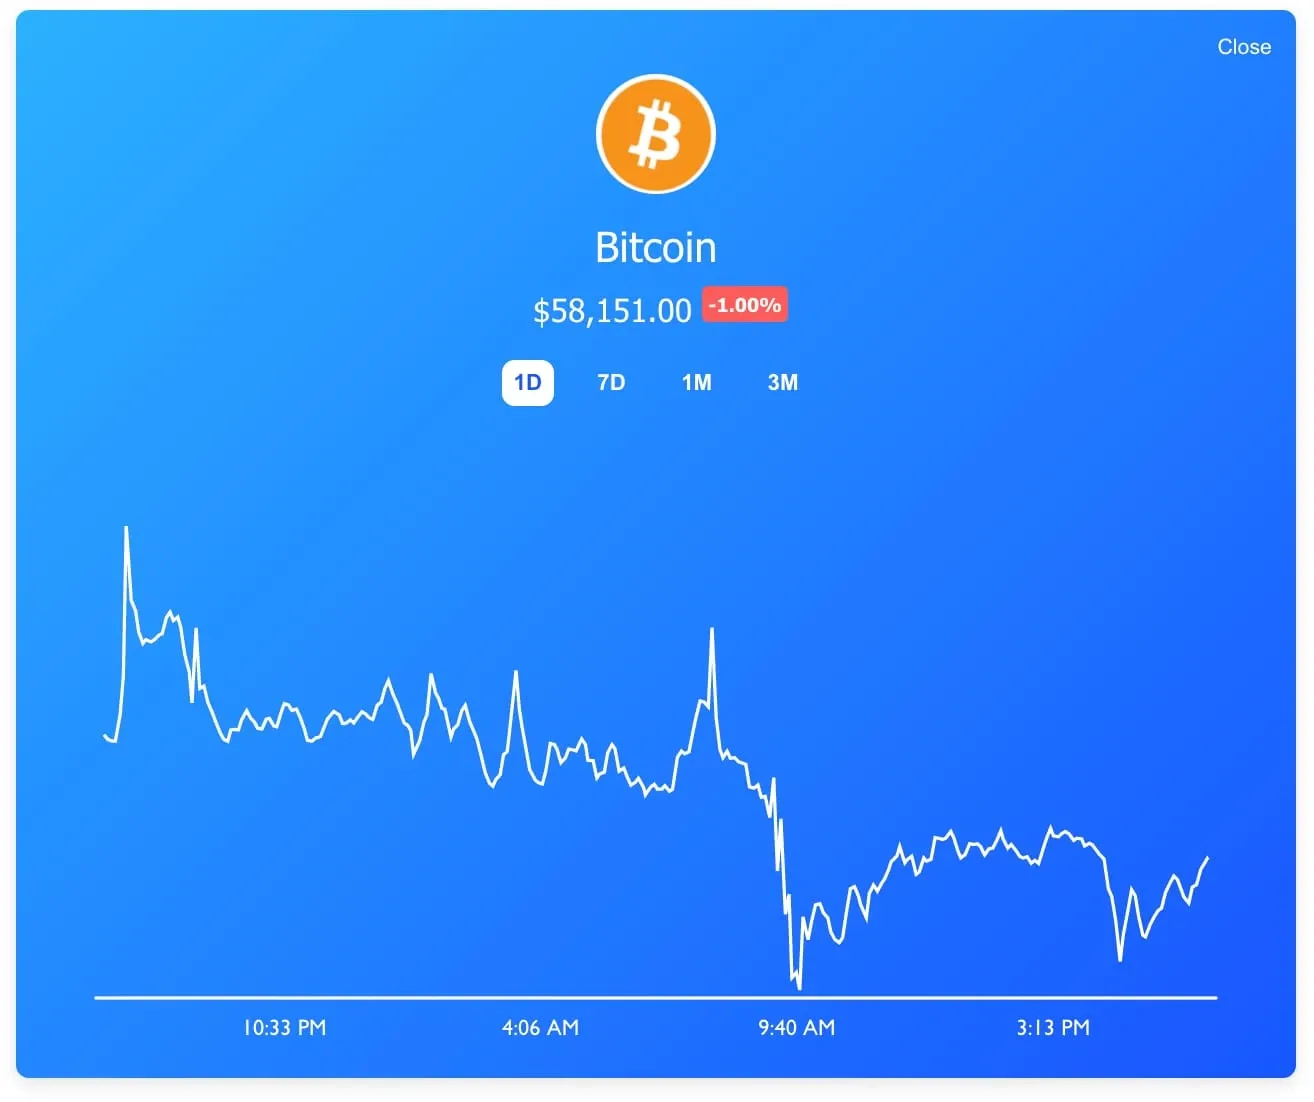
The price tracker will initially display some basic info, and clicking on the data will expand to show a large chart with prices for the past day, week, month, or three-month period.
If Bitcoin isn't your favorite crypto, don't worry: the code is structured in a way where you can easily track another crypto just by changing a prop value.
This post is not sponsored by CoinGecko, React Query, or Victory Charts.
What is React Query?
If you've worked with data that becomes stale quickly, like stock prices, or in our case crypto prices, then you know writing logic to determine when to fetch data, how to cache it, and when to fetch it again can be very tedious.
In projects where you just want a (mostly) drop-in solution for working with data, React Query is a great option. The docs pretty accurately explain what to expect:
Tell React Query where to get your data and how fresh you need it to be and the rest is automatic. - React Query docs.
How we use React Query in this tutorial is exactly as described above. We'll use it to fetch, re-fetch, and cache crypto data from the CoinGecko API.
Make sure React Query is installed in your environment before moving forward.
Crypto Price Tracker Base Component
First, we want to create the main price tracker component. It will render the Bitcoin logo, the current price, a positive or negative percentage, and a sub-component containing chart functionality. We'll cover the chart specifically later on.
To start, make a new file named CryptoTracker.jsx.
In it, add one state value via the useState hook that we'll use to determine if the tracker is expanded or collapsed.
We will also have one prop, cryptoName, that's passed to our CryptoTracker component to control which cryptocurrency data to display.
You can change cryptoName to any other cryptocurrency you'd like – we'll be using bitcoin.
Next add a function named onCardClick to handle updating the isExpanded state.
import React, { useState } from 'react';

const CryptoTracker = ({ cryptoName }) => {
	const [isExpanded, setIsExpanded] = useState(false);

	const onCardClick = () => {
	  if (!isExpanded) {
	    setIsExpanded(true)
	  }
	}

	return ...
}
Now let's add the shell of our crypto tracker "card" markup. We'll revisit this again in the next section once we have data to work with.
const CryptoTracker = ({ cryptoName }) => {
	...
	...

	return (
		<div className={`card ${isExpanded ? 'expanded' : 'collapsed'}`}>
      {!isExpanded && (
        <button onClick={onCardClick} className="hitzone" />
      )}
      <div className="card-inner">
        {isExpanded && (
          <button className="close" onClick={() => setIsExpanded(false)}>Close</button>
        )}
        <div className="top-data">
          TODO BTC info here
        </div>
      </div>
    </div>
	);
}
If the card is not expanded, we want to render a button with a class of hitzone that contains the onClick function needed to expand the card when it's clicked.
This "hitzone" button is positioned in front of the card with CSS as a way to avoid adding an
onClickhandler directly to thecarddiv element for accessibility purposes. Another way would have been to add aria tags, roles, and keyboard events along with a click handler to the div to make it more accessible, but we get all of that for free by using a button.
Setting Up React Query
With our base component setup done, let's start fetching some data about Bitcoin from the CoinGecko API. I chose this API because it provides the data I needed for this post (for free!), with a generous rate limit of 100 requests/minute. Please keep that rate limit number in mind if you see any errors in your requests for the remainder of this tutorial.
First, we need to get set up. In order to use React Query, we wrap any components that require its functionality with a QueryClientProvider and provide that with a client.
import { QueryClient, QueryClientProvider } from "react-query";
import { ReactQueryDevtools } from "react-query/devtools";

const queryClient = new QueryClient();

const App = () => (
  <QueryClientProvider client={queryClient}>
    <CryptoTracker cryptoName="bitcoin" />
    <ReactQueryDevtools /> // Optional tool, but recommended
  </QueryClientProvider>
);
Create a new instance of QueryClient, and pass it to QueryClientProvider, which wraps the CryptoTracker component. Your environment or component hierarchy might look slightly different, but the important part is making sure that CryptoTracker is a child of QueryClientProvider.
A note about tooling. React Query ships its own
ReactQueryDevToolsthat you can place anywhere in your app for some very useful info on the state of your data. Optional, but highly recommended!
Once React Query is set up, we'll be using the useQuery hook for everything else. The useQuery hook lets us fetch data, decide when it's stale for re-fetching, and get information about the progress of the request.
The useQuery hook takes three main parameters:
queryKey. This can be a string, an array or a variable. If this value changes, the query will re-run.queryFn. A function for the data fetching. It must return apromise.- An options object to dial in the behavior you want.
There's a lot more about the
useQueryhook that we won't be covering here, so be sure to check out the docs for more info.
Back in the CryptoTracker file, let's add the data fetching query inside a custom React hook named useGetCardData. Using a custom hook helps declutter the component itself and allows for reusability if we need the hook again later.
In the query itself, the key we provide is a string like bitcoin-card.
import { useQuery } from 'react-query';

const useGetCardData = (cryptoName, options) => {
  return useQuery(`${cryptoName}-card`, async () => {
    const response = await fetch(`https://api.coingecko.com/api/v3/coins/${cryptoName}`);
    return await response.json();
  }, options);
}
Now we can use it by passing the cryptoName prop and an options object. The options object determines when to consider the data stale staleTime and when to re-request the data, refetchInterval. For our purposes, we want to refetch once a minute.
const CryptoTracker = ({ cryptoName }) => {
  ...

  const { data, isLoading } = useGetCardData(cryptoName, {
    refetchInterval: 60000,
    staleTime: 60000,
  });
useGetCardData returns the same values that useQuery does: a constant named data that contains the resolved response, and isLoading which indicates that the request is loading.
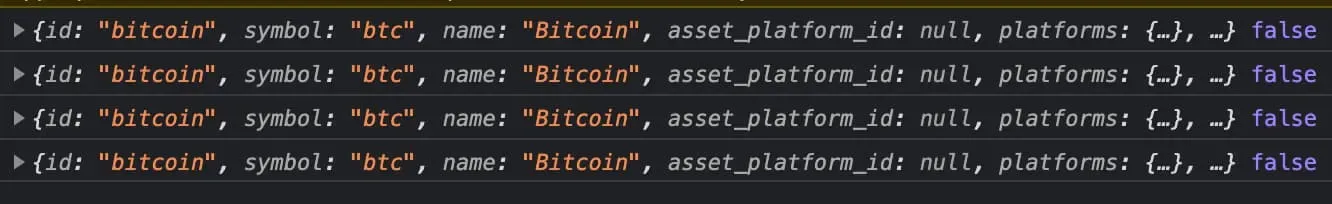
Let's pause here quickly to try out the query by logging both the isLoading and data values to the console, or by viewing the React Query devtool panel.
const { data, isLoading } = useGetCardData(cryptoName, {
  refetchInterval: 60000,
  staleTime: 60000,
});

console.log(data, isLoading);

return ( ... );
Using the Crypto Data
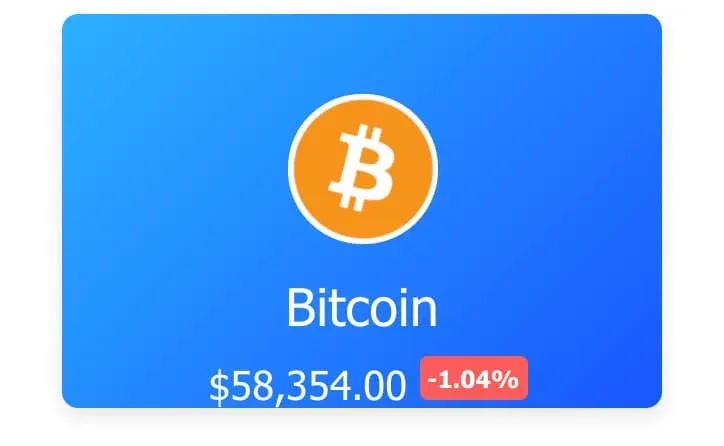
Now that we have data to work with, let's finish adding the rest of the display elements: the Bitcoin logo and name, the current price, and a percentage of the increase/decrease in the last 24 hours.
const CryptoTracker = ({ cryptoName }) => {
	...

	const { data, isLoading } = useGetCardData(cryptoName, {
	  refetchInterval: 60000,
	  staleTime: 60000,
	});

	if (isLoading) return null;

	const {
    image,
    name,
    market_data: marketData,
  } = data;

	return (
		<div className={`card ${isExpanded ? 'expanded' : 'collapsed'}`}>
      ...
      <div className="card-inner">
        ...
        <div className="top-data">
          <img src={image?.large} alt={`${name} logo`} />
          <h3 className="crypto-name">{name}</h3>
        </div>
      </div>
    </div>
	);
}
Notice that we are using the
isLoadingvalue to prevent rendering anything until we're ready. We could have gotten fancy with a skeleton loader, but that's a bit beyond the scope of this post. Instead, check out How to Build a Skeleton Loading Placeholder if you're curious how to do this yourself.
Adding the Bitcoin logo and the name are simple, but the pricing info is a bit more involved.
For this, we'll add two new functions. The first takes a price number like 58930 and formats it to $58,930.00, or whichever country-specific format you'd like using Intl.NumberFormat.
// Make sure to export this to use later on
export const formatPrice = (price) => {
  const formatConfig = new Intl.NumberFormat("en-US", {
    style: "currency",
    currency: "USD",
    minimumFractionDigits: 2,
  });

  return formatConfig.format(price);
}
The other function, formatPlusMinus will check the price change percentage value for the past 24 hours. If it's a positive number, or zero, we return a span element with a positive class. We'll also prepend a + to the number. Otherwise, it returns a span with a negative class. These classes will be styled green or red in the next section.
const formatPlusMinus = (priceChange) => {
  const isPositive = Math.sign(priceChange) >= 0;

  return (
    <span className={`${isPositive ? 'positive' : 'negative'}`}>
      {`${isPositive ? '+' : ''}${priceChange.toFixed(2)}%`}
    </span>
  );
}
Finally let's use the formatPrice and formatPlusMinus functions we just wrote in our JSX.
<div className="top-data">
  <img src={image?.large} alt={`${name} logo`} />
  <h3 className="crypto-name">{name}</h3>
  <h4 className="crypto-price">
    {formatPrice(marketData?.current_price?.usd)}
    {formatPlusMinus(marketData?.price_change_percentage_24h)}
  </h4>
</div>

Now we have our data displaying, but it doesn't look too great yet. Let's fix that with some CSS.
:root {
  --blue: #1855ff;
  --white: #fff;
  --green: #41e041;
  --red: #ff5b5b;
  --border-radius: 8px;
}

button {
  background: none;
  border: none;
  cursor: pointer;
}

.hitzone {
  cursor: pointer;
  position: absolute;
  left: 0;
  right: 0;
  height: 100%;
  width: 100%;
  z-index: 2;
}

.card {
  text-align: center;
  color: var(--white);
  margin: auto;
  max-width: 300px;
  background: linear-gradient(135deg, #2bb1ff 0%, var(--blue) 100%);
  border-radius: var(--border-radius);
  position: relative;
  transition: transform 0.5s ease, box-shadow 0.5s ease;
  box-shadow: 0 4px 10px rgb(0 0 0 / 10%);
}

.card:not(.expanded):hover {
  transform: translateY(-3px);
  box-shadow: 0 4px 12px rgb(0 0 0 / 50%);
}

.card-inner {
  position: relative;
}

.top-data {
  padding: 40px 25px 0;
}

.card img {
  width: 75px;
  height: 75px;
  background: var(--white);
  padding: 2px;
  border-radius: 50px;
}

.crypto-name {
  font-size: 26px;
  font-weight: 300;
  margin: 12px 0;
}

.crypto-price {
  font-size: 20px;
  margin: 12px 0 0;
  font-weight: 300;
}

.crypto-price span {
  font-size: 12px;
  font-weight: 700;
  position: relative;
  top: -6px;
  left: 6px;
  padding: 4px;
  border-radius: 4px;
}

.crypto-price svg {
  margin-right: 4px;
}

.positive {
  background: var(--green);
}

.negative {
  background: var(--red);
}
Note that the bottom padding is intentionally 0. We'll be adding that next.
Expanding the Card
Next we'll add some additional CSS to display the card in an "expanded" state. This allows us to show the full-sized chart.
.expanded.card {
  max-width: 800px;
}

.expanded .top-data {
  padding: 40px 25px 20px;
}

.close {
  position: absolute;
  color: var(--white);
  right: 10px;
  top: 10px;
  padding: 5px;
  z-index: 1;
}

Charting Crypto Data
Now for the crypto price charts! Writing charts from scratch is way beyond the scope of this article, so instead we'll use a charting library. There are a lot of good component-based libraries to choose from, and I chose Victory Charts. I was looking for an option that was customizable, composable, and easy to use. I think it checks all three boxes, but it certainly doesn't mean there aren't other great libraries out there.
Install Victory Charts via npm install victory before moving on.
We'll also need to do some very light time/date formatting on the data we get back from the API. For this we'll use date-fns, so make sure to install that as well.
We want the charts to work like this:
- Initially display a small version of the 24 hour chart data.
- Once the card is expanded, display a full-size chart.
- Refetch the data and redraw the chart if a different time interval is clicked.
- We want the large chart variation to display a price tooltip on hover.
Let's start by creating a new component named ChartData.jsx and adding some imports.
import React, { useState } from 'react';
import { useQuery } from 'react-query';
import {
  VictoryLine,
  VictoryChart,
  VictoryAxis,
  VictoryTooltip,
  VictoryVoronoiContainer,
} from 'victory';
import format from 'date-fns/format';
// For price formatting (we wrote this earlier and made it an export for this reason!)
import { formatPrice } from './CryptoTracker';

const ChartData = ({ cryptoName, isExpanded }) => {

}
Our component will take cryptoName and isExpanded as props from the parent CryptoTracker we added earlier.
Next, we should define the intervals to make requests for: 1 day, 7 days, 1 month, and 3 months. The active interval defaults to 1 day inside a state value of dataInterval.
const intervals = [
  {
    label: '1D',
    value: 1,
  },
  {
    label: '7D',
    value: 7,
  },
  {
    label: '1M',
    value: 30,
  },
  {
    label: '3M',
    value: 90,
  },
];

const ChartData = ({ cryptoName, isExpanded }) => {
	const [ dataInterval, setDataInterval ] = useState(intervals[0].value);
}
Back in the
CryptoTracker, don't forget to import this new component and pass it thecryptoNameandisExpandedprops.
Now let's add a useQuery hook to get the charting data. Note that this data is from a different API endpoint, but not too different from what we wrote earlier.
We'll add another custom hook named useGetChartData to handle it.
const useGetChartData = (cryptoName, interval, options) => {
  return useQuery(['chartData', interval], async () => {
    const response = await fetch(`https://api.coingecko.com/api/v3/coins/${cryptoName}/market_chart?vs_currency=usd&days=${interval}`);
    return await response.json();
  }, options);
}
The main difference you'll notice in this useQuery is that the key is an array: ['chartData', interval]. This is because the query should re-run and fetch new data when the interval value changes.
Now use the hook and pass it the params it needs.
const ChartData = ({ cryptoName, isExpanded }) => {
  const [ dataInterval, setDataInterval ] = useState(intervals[0].value);

  const {
    isLoading,
    data,
  } = useGetChartData(cryptoName, dataInterval, {
    refetchInterval: 60000,
    staleTime: 60000,
  });

	return (...)
}
We get back values of data and isLoading just like last time to use in our JSX.
Let's add in the actions that control the dataInterval state.
const ChartData = ({ cryptoName, isExpanded }) => {
  const [ dataInterval, setDataInterval ] = useState(intervals[0].value);
	...
  return (
    <div className="chart">
      <div className="chart-actions">
        {intervals.map((interval) => (
          <button
            key={interval.value}
            className={`${dataInterval === interval.value ? 'active' : 'inactive'}`}
            onClick={() => setDataInterval(interval.value)}
          >
            {interval.label}
          </button>
        ))}
      </div>
		</div>
	);
}
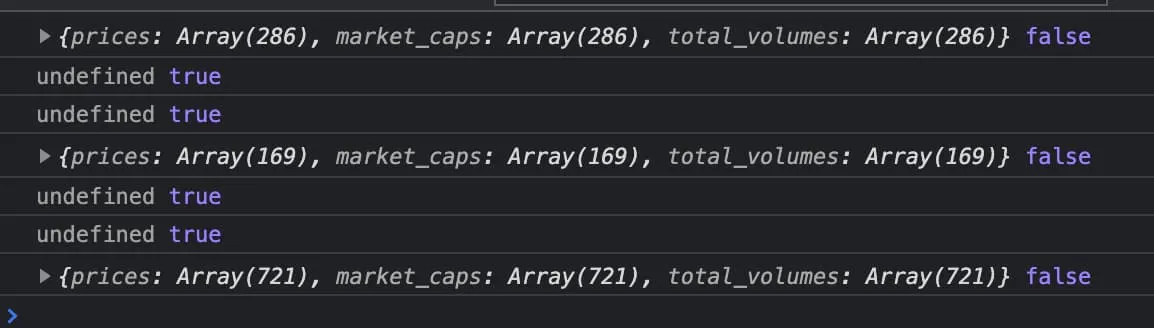
Log the data and isLoading values to the console to check if things are working when clicking the chart action buttons.
A great advantage that we get out of the box with React Query is caching. If you happen to click from 1 day to 7 days, then back again, you won't need to request the data because it's been cached until we decide it's stale (1 minute). You'll notice this in the Network tab if you filter by XHR requests. Caching data like this helps prevent a lot of excessive requests.
There are some styles to go along with the actions we just added, and for the charts in general.
.chart {
  position: relative;
}

.chart svg {
  vertical-align: middle;
}

.chart-actions {
  display: none;
}

/* Only display the actions when expanded */
.expanded .chart-actions {
  display: block;
  margin-bottom: 20px;
}

.chart-actions button {
  color: var(--white);
  font-weight: 700;
  font-size: 14px;
  margin: 0 10px;
  padding: 6px;
  border: 1px solid transparent;
  border-radius: var(--border-radius);
  outline: none;
}

.chart-actions button:hover,
.chart-actions button:focus {
  border: 1px solid var(--white);
}

.chart-actions .active {
  background: var(--white);
  color: var(--blue);
}
Formatting the Chart Data
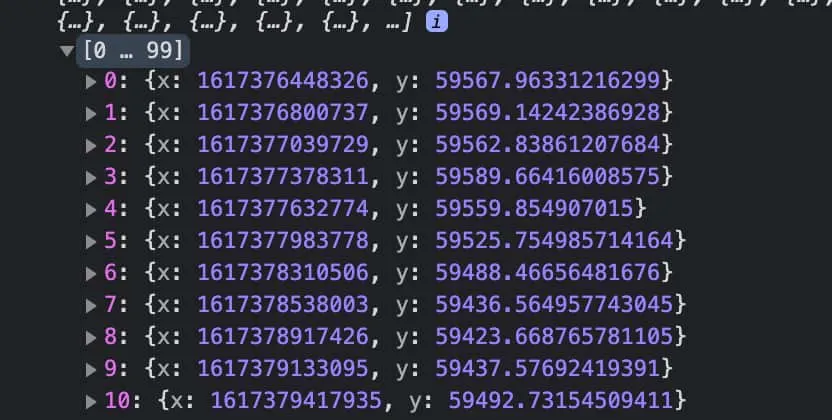
Before moving on, we need to make one small change to the overall shape of the data. The <VictoryLine /> component that we'll be using expects an array of datapoint objects with an x and y coordinate, like: { x: 1617374912185, y: 59270.40170646927 }. Currently, we have an array of arrays. We also only care about the prices array returned in the request. market_caps and total_volumes won't be used.
Fortunately we can shape the data how we want by using the select option.
This option can be used to transform or select a part of the data returned by the query function. - useQuery docs
We'll use it to iterate through the prices array and return an x and y coordinates object for each datapoint, and discard anything else we don't need.
const {
  isLoading,
  data,
} = useGetChartData(cryptoName, dataInterval, {
  refetchInterval: 60000,
  staleTime: 60000,
	select: (data) => data?.prices?.map((item) => ({
    x: item[0],
    y: item[1],
  })),
});
If you log the data to the console, it should be what we want now. The x value is the timestamp (date), and the y is the price.
With this in place, now we can finally start visualizing the data! We'll start with the small chart that appears when the card isn't expanded.
If the request is loading, the isLoading constant is used to show a loading state. Once the request has resolved, the VictoryLine component will render the chart itself. Since this specific chart is more visual than functional, we won't need to render a chart axis.
return (
  <div className="chart">
    <div className="chart-actions">
			...
    </div>

		{isLoading ? (
      <div className="loading-container">
        <span>Loading...</span>
      </div>
      ) : (
        <VictoryLine
          style={{
            data: {
              stroke: "#fff",
              strokeWidth: 2,
            },
          }}
          width={300}
          height={150}
          data={data}
        />
			)}
	</div>
);
The VictoryLine component can be passed a lot of different prop values, but all we need to give it is the data to use, a height and width, and some styles.
There are a few styles for the loading container as well.
.loading-container {
  height: 0;
  padding-bottom: 50%;
  width: 100%;
}

.loading-container span {
  position: absolute;
  left: 50%;
  margin-left: -35px;
  top: 30%;
}
Full-Size Price Chart
Now for the full-size price chart. For this we'll use the rest of the Victory components we imported earlier.
We'll need to update the ternary we added in the last section because now we want to change the chart we render based on the isExpanded prop, while still displaying a loading state when needed.
return (
	<div className="chart">
		{isLoading ? (
	    <div className="loading-container">
	      <span>Loading...</span>
	    </div>
	  ) : (
	    !isExpanded ? (
	      <VictoryLine
	        style={{
	          data: {
	            stroke: "#fff",
	            strokeWidth: 2,
	          },
	        }}
	        width={300}
	        height={150}
	        data={data}
	      />
	    ) : (
	      <VictoryChart
	        width={800}
	        height={400}
	        domainPadding={5}
				>...</VictoryChart>
			)
		)}
	</div>
);
The <VictoryChart> component should wrap all other components that make up the chart. Provide it a height/width and also a domainPadding prop that adds some slight padding between the axis and the chart line.
Next, we'll use the <VictoryLine /> component to display the chart data, just as we did previously with the small chart.
<VictoryChart
  width={800}
  height={400}
  domainPadding={5}
>
	<VictoryLine
    style={{
      data: {
        stroke: "#fff",
        strokeWidth: 2,
      },
    }}
    data={data}
  />
</VictoryChart>
Now use the <VictoryAxis /> component to render an x axis that displays the time. AM or PM if viewing in a 1-day interval, or the date if viewing in any other interval.
<VictoryChart
  width={800}
  height={400}
  domainPadding={5}
>
	<VictoryLine ... />
  <VictoryAxis
	  orientation="bottom"
	  style={{
	    axis: {
	      stroke: '#fff',
	      strokeWidth: 2,
	    },
	    tickLabels: {
	      fill: '#fff',
	    },
	  }}
	  tickFormat={(x) => {
	    if (dataInterval  === 1) {
	      return format(x, 'p');
	    }

	    return format(x, 'MM/dd');
	  }}
	/>
</VictoryChart>
Notice the tickFormat function. This allows us to format the date, and it's where we'll use the format function from date-fns. If we are showing data from the past 24 hours, we want to format the date as 2:00pm or 2:00am, otherwise format as MM/dd like 03/29.
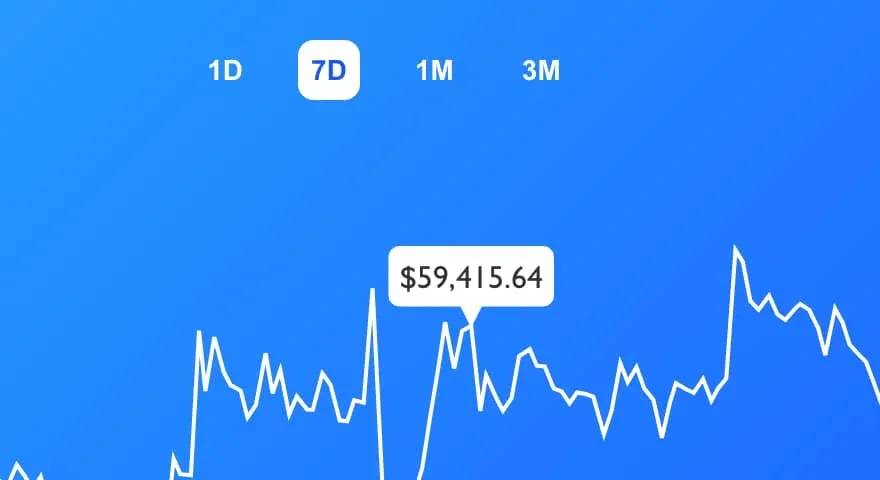
Price Chart Tooltip
The last thing to do is render a tooltip for our chart using <VictoryTooltip />. This will show the price at any particular point when hovering over the line. But, because we're using a line chart for our data, we can't use the VictoryTooltip component directly as the chart actually consists of a single SVG element.
When providing tooltips for
VictoryLineorVictoryArea, it is necessary to useVictoryVoronoiContainer, as these components only render a single element for the entire dataset. - Victory docs
We need to modify the VictoryChart to use a specific container component that renders the tooltip, which in this case is VictoryVoronoiContainer.
VictoryVoronoiContaineradds the ability to associate a mouse position with the data point(s) closest to it. When this container is added to a chart, changes in mouse position will add the active prop to data and label components closest to the current mouse position - VictoryVoronoiContainer docs
To determine what to show inside the tooltip, we can use the labels prop. The function you provide is called once for each datapoint, and returns the x and y info. Since the price is the y value, it can be formatted using the formatPrice function we wrote earlier.
<VictoryChart
  width={800}
  height={400}
  domainPadding={5}
	containerComponent={
    <VictoryVoronoiContainer
      labels={({ datum }) => formatPrice(datum.y)}
			title={`${cryptoName} price data chart`}
      labelComponent={
        <VictoryTooltip
          style={{
            fill: '#333',
            fontSize: 16,
          }}
          flyoutStyle={{
            fill: "#fff",
            stroke: '#fff',
            strokeWidth: 1,
            margin: 10,
          }}
        />
      }
    />
  }
>
	...
</VictoryChart>
Now use the labelComponent prop that VictoryVoronoiContainer provides and pass it the <VictoryTooltip /> component.
Conclusion
We covered a lot of ground in this post, and if you made it this far, thanks for reading! Using this combination of React Query, Victory Charts, and the CoinGecko API, we were able to write a fairly straightforward set of components to handle data fetching, caching, and charting.
We barely scratched the surface of what you can do with React Query and Victory Charts, so please check out their documentation to learn more.